User Journey Monitoring: Stop Watching CPU, Start Protecting Revenue
Most SaaS teams monitor CPU and memory. But if your checkout endpoint is down, none of that matters.
Your servers can be humming along at 15% CPU utilization while your payment flow returns a 502, your onboarding webhook silently fails, and your trial-to-paid conversion rate craters. Infrastructure metrics tell you the health of your machines. They don't tell you whether users can actually do the thing that makes you money.
That's the core problem with how most teams approach uptime monitoring, and it costs SaaS companies real revenue, not hypothetical risk.

The Metric Gap: Servers vs. Sessions
Traditional monitoring stacks were designed for infrastructure teams. They answer questions like: Is the database reachable? Is memory pressure high? Is the load balancer responsive?
Valid operational questions. But they're the wrong primary questions for a SaaS product where revenue is tied directly to user workflows completing successfully.
SaaS monitoring best practices increasingly prioritize user journeys and critical business workflows over raw infrastructure metrics, because a healthy server means nothing if the checkout endpoint is timing out. Consider what a 10-minute outage on your /api/subscriptions/upgrade endpoint actually costs:
- A SaaS product with $50K MRR loses roughly $1,150/hour in subscription revenue during peak hours
- Trial users who hit errors during onboarding convert at significantly lower rates and rarely come back
- B2B customers tracking SLA compliance will log the incident whether you do or not
The problem isn't that teams don't care about these outcomes. It's that their monitoring setup isn't instrumented to catch them before users do.
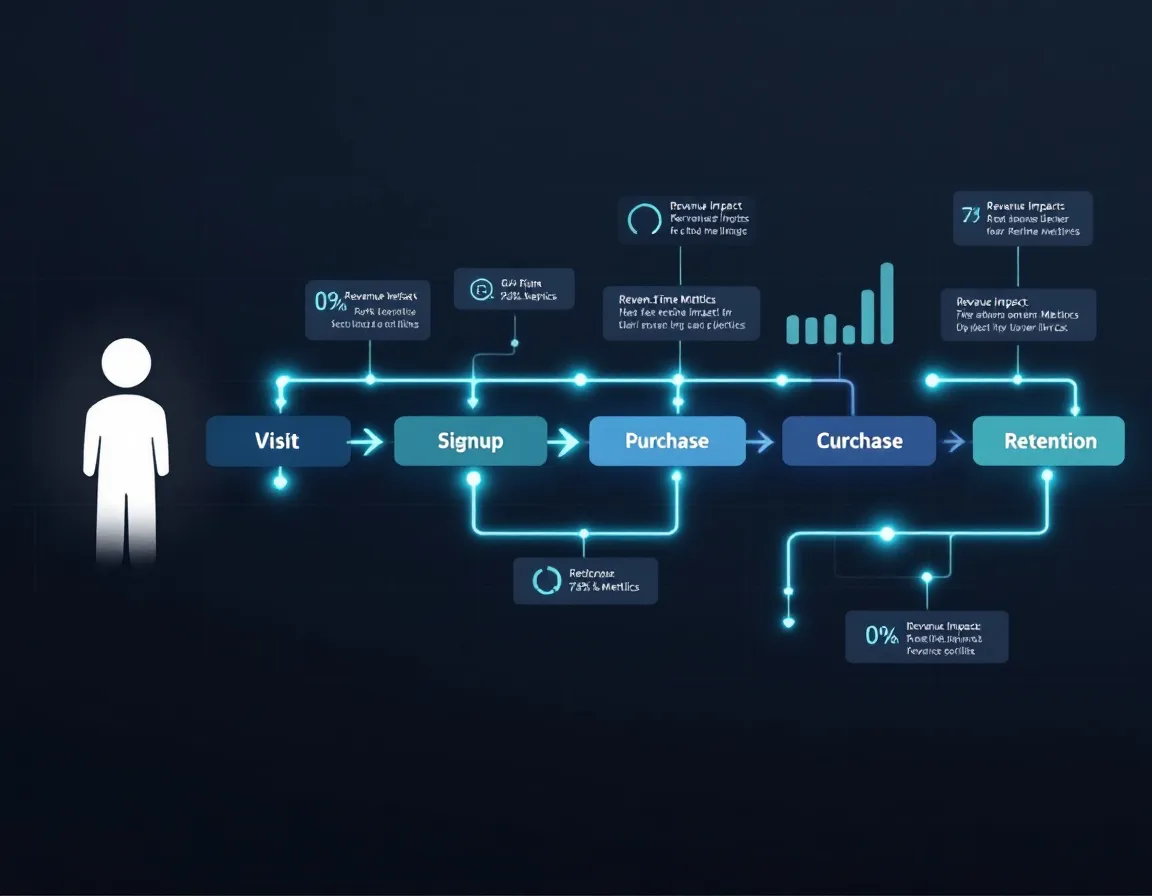
What User Journey Monitoring Actually Means
User journey monitoring means treating critical business workflows as first-class monitoring targets, not afterthoughts.
In practice, you define and continuously check the sequences that generate revenue or retain users:
Tier 1: Revenue-Critical Paths
- Authentication flow (login to session creation)
- Upgrade and payment endpoints
- API endpoints consumed by paying customers
- Webhook delivery for integrations your customers depend on
Tier 2: Retention-Critical Paths
- Onboarding sequences (account creation through first meaningful action)
- Data export endpoints
- Core feature workflows, meaning the thing your product is actually for
Tier 3: Signal Endpoints
- Status pages and health check routes
- CDN asset delivery
- Third-party dependency health (Stripe, Auth0, Twilio)
Monitoring these distinct layers requires a multi-tiered strategy: synthetic transaction checks, real-user monitoring signals, and endpoint-level alerting working in combination, not in isolation.
Critical Endpoint Monitoring: The Implementation Layer
Once you've mapped your user journeys, the implementation is mostly about discipline and tooling.
Check frequency matters more than you think. A 5-minute check interval means a checkout endpoint can be down for up to 4 minutes and 59 seconds before you get alerted. For high-traffic SaaS products, that's not acceptable. 30-second intervals are the practical minimum for Tier 1 endpoints.
SSL and DNS are silent killers. An expired certificate or misconfigured DNS record fails the entire journey before a single line of your application code executes. These need independent monitoring that doesn't assume your app layer is healthy.
Status pages are part of your SLA contract. Whether you're managing SLA compliance tracking for enterprise customers or just maintaining trust with a freemium base, a public status page that reflects real-time endpoint health, not "all systems go" theater, is table stakes.
This is the problem PulseGuard was built to solve for teams that don't have the budget or headcount for enterprise observability stacks. It offers AI-ready monitoring for freelancers, agencies, and small teams: 30-second uptime checks, SSL/DNS/security monitoring, status pages, and MCP access for ChatGPT/Claude-style workflows, so you can get real monitoring coverage without stitching together five different tools.
Incident Response: Cutting Mean Time to Resolution
Monitoring catches the problem. Process determines how fast you fix it.
Incident response playbooks reduce chaos during outages by providing standardized, role-based procedures that teams can execute in minutes rather than hours. For each Tier 1 endpoint you monitor, there should be a corresponding runbook entry that answers:
- Who gets paged first?
- What's the rollback procedure if a deploy caused it?
- What's the customer communication threshold: 5 minutes or 15?
- Who owns the post-mortem?
Without this, every incident becomes a coordination tax on your engineering team. Even ones that take 8 minutes to fix technically can take 45 minutes to resolve organizationally.
Practical Takeaways
If you're rethinking your monitoring setup, start here:
- Audit your current alerts. How many trigger on infrastructure metrics vs. user-facing endpoint failures? If infrastructure dominates, you have a blind spot.
- Map your Tier 1 journeys this week. List the five endpoints that, if they fail, directly stop revenue from flowing. These get 30-second checks and pager-level alerts.
- Add SSL and DNS monitoring independently. Don't assume your uptime check covers certificate expiry. Most don't.
- Write a one-page incident runbook for each Tier 1 endpoint before you need it. It doesn't need to be elegant. It needs to exist.
- Instrument a public or private status page that reflects actual endpoint health, not just self-reported operational status.
Teams using PulseGuard can get Tier 1 endpoint coverage, SSL/DNS monitoring, and a public status page running in under 20 minutes, which is a reasonable benchmark for how long your initial setup should take regardless of what tooling you choose.
Monitor what users experience. Everything else is secondary.
Sources
- SaaS Monitoring: Metrics, Tools, And Best Practices Explained | UptimeRobot Knowledge Hub
- Challenges and Best Practices for Monitoring SaaS-based Businesses - Dotcom-Monitor Web Performance Blog
- Odown Blog | SaaS Application Monitoring Best Practices: A Complete Guide
- The 5 Most Popular SaaS Monitoring Tools for 2025 | Cledara
- Best uptime monitoring tools for 2026 (free and paid) - OnlineOrNot
- Are Core Web Vitals A Ranking Factor for SEO? | DebugBear
- Exploring how does Core Web Vitals affect SEO Rankings: Google Search Insights
- Core Web Vitals SEO Impact – Are They a Ranking Factor?