The SaaS Monitoring Stack: From Uptime to Performance
Most SaaS teams monitor whether their service is up. But availability without performance is only half the picture.
A green status indicator means your endpoint responded. It says nothing about whether that response took 200ms or 8 seconds, whether your database connection pool is sitting at 94% utilization, or whether your SSL certificate expires in four days. For users, a slow app and a down app feel nearly identical. For your on-call engineer, only one of them fires an alert.
Here's what a complete SaaS monitoring stack actually looks like, and where most teams have dangerous blind spots.
Why Uptime Alone Is an Incomplete Signal
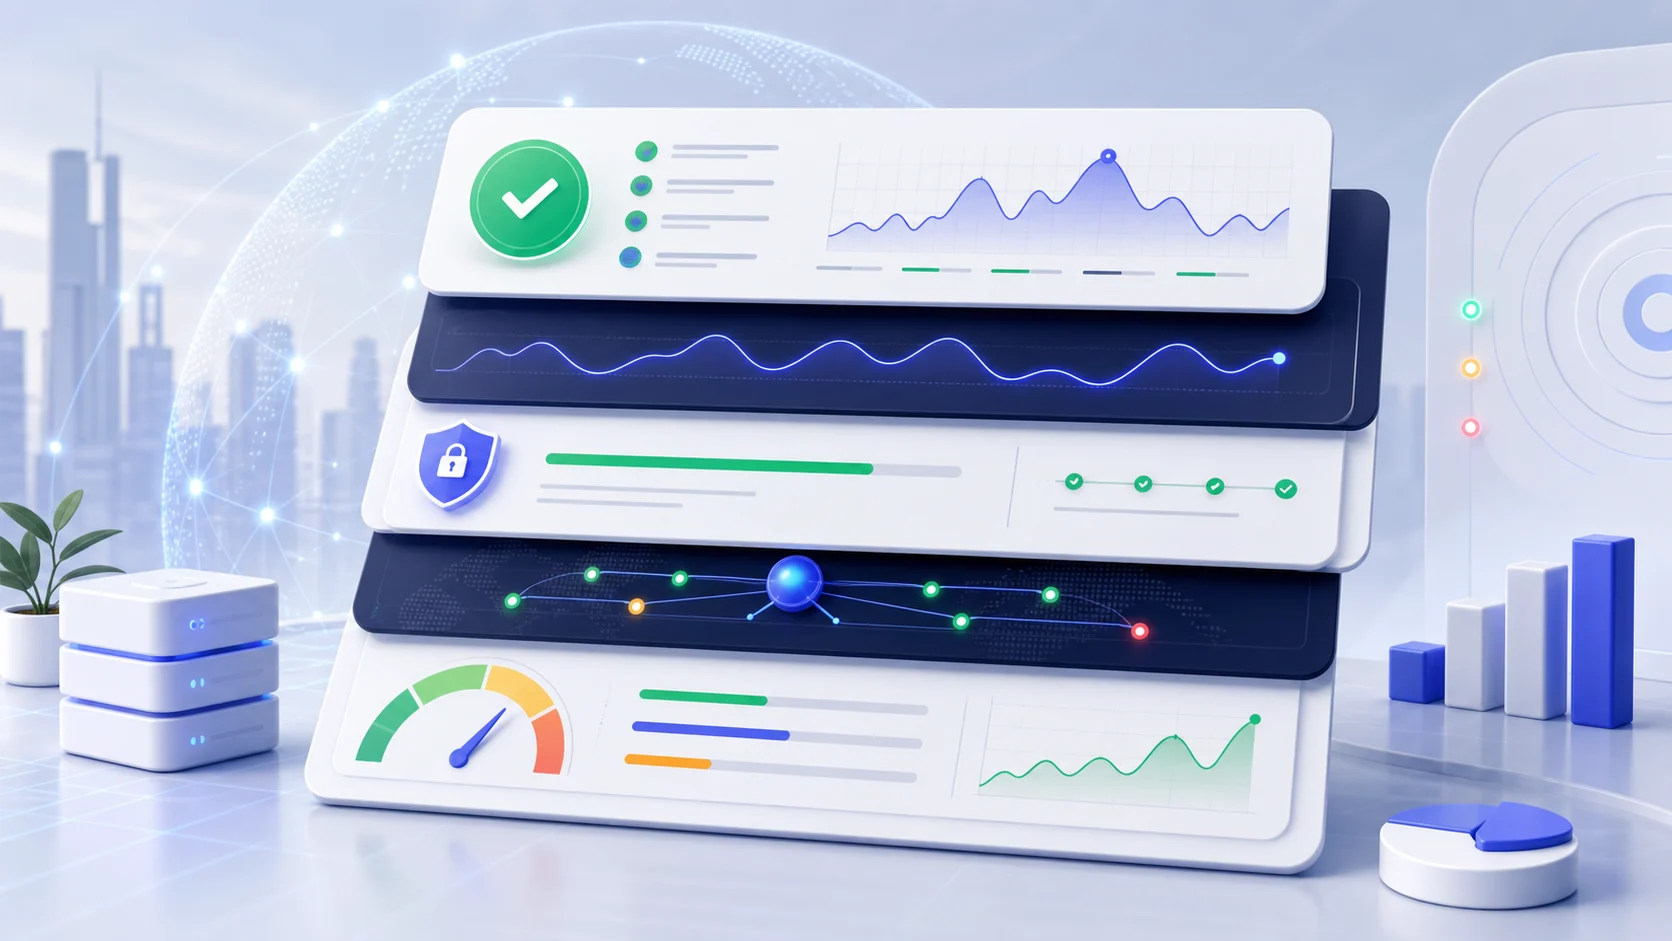
Basic uptime monitoring answers one binary question: did the server respond? Necessary, but not sufficient. Effective SaaS monitoring requires a layered approach combining uptime detection, performance tracking, and error visibility rather than treating any single metric as a proxy for system health.
Here's what uptime checks typically miss:
- Degraded performance: your API responds with HTTP 200, but p95 latency has tripled
- Partial failures: authentication works, but file uploads silently fail
- Infrastructure rot: SSL certificates approaching expiry, DNS TTLs misconfigured
- Error rate spikes: your service is "up" but 15% of requests are returning 500s
Teams that catch these issues before users do have moved beyond ping-style checks into a monitoring architecture with multiple layers.
The Three Layers Every SaaS Stack Needs
Layer 1: Uptime and Availability
This is your foundation. Uptime monitoring tools should check from multiple geographic regions at short intervals. 30 seconds is the practical minimum for anything customer-facing. Longer polling intervals create detection gaps where outages go unreported for minutes.
Key coverage here includes:
- HTTP/HTTPS endpoint checks
- TCP port monitoring for non-HTTP services
- SSL certificate expiry tracking (alert at 30 days, escalate at 7)
- Domain and DNS record validation
That last point is where many teams are dangerously complacent.
Layer 2: Infrastructure and DNS Health
DNS failures get treated like acts of god. They're largely preventable. Multi-provider DNS redundancy, Anycast routing, and proactive expiration monitoring eliminate the majority of DNS-related outages before they happen. A single DNS provider with no fallback is a single point of failure that doesn't show up in your uptime SLA until it causes a full outage.
Practical DNS hardening looks like:
- Secondary DNS providers configured with identical zone data
- Anycast routing to distribute query load and reduce geographic latency
- Automated alerts on TTL anomalies, record changes, and registration expiry
Most uptime monitors don't surface DNS-layer failures distinctly. They just report the endpoint as down. You need tooling that distinguishes "server unreachable" from "DNS resolution failed" if you want to diagnose and fix issues quickly.
Layer 3: Performance and Database Visibility
This is where production incidents quietly incubate. Connection pool exhaustion is one of the most common causes of slow-rolling degradation under traffic spikes. By the time your uptime check fires, users have already been experiencing timeouts for minutes.
Metrics worth instrumenting proactively:
- Pool utilization %: alert at 70%, escalate at 85%
- Connection wait time: rising wait times precede exhaustion
- Active vs. idle connections: ratio shifts signal connection leaks
- Query latency by percentile: p99 will spike long before p50 moves
The key word is proactive. Reactive alerting on these metrics, waiting for the pool to hit 100%, leaves you chasing fires. Trend-based alerting on rate of change gives you time to act.
Synthetic Monitoring: The Missing Middle Layer
Synthetic monitoring sits between uptime checks and full APM. You define scripted user journeys, like login, checkout, and API authentication, then run them continuously from external locations. This gives you end-to-end latency data and catches regressions that endpoint pings miss entirely.
SaaS monitoring best practices increasingly treat synthetic checks as essential rather than optional, particularly for teams without the engineering bandwidth to instrument every service with custom telemetry.
Tools like Baromio address exactly this gap for smaller engineering teams. It provides monitoring for freelancers, agencies, and small teams: 30-second uptime checks, SSL/DNS/security, status pages, and MCP access for ChatGPT/Claude-style workflows, without requiring dedicated infrastructure.
Incident Response Starts Before the Alert Fires
Monitoring is only as useful as the workflow it feeds into. A well-structured stack produces:
- Distinct alert categories: uptime, performance, and security alerts routed differently
- Contextual runbooks: linked directly from alert payloads
- Public status pages: reduce support ticket volume during incidents by giving users a single source of truth
At Baromio, the status page and alert system are treated as a single workflow rather than separate tools. That design decision significantly reduces mean time to communication during incidents.
Practical Takeaways
Before your next on-call rotation, audit your stack against these five questions:
- Are you checking from multiple regions? Single-region uptime checks produce false negatives on regional routing issues.
- What's your SSL expiry runway? If it's under 30 days and you're handling renewals manually, you're one missed renewal away from an outage.
- Do you have a secondary DNS provider? If not, your uptime SLA is only as reliable as your DNS vendor's.
- Are you tracking database connection pool utilization? Threshold alerts at 70% give you lead time. Alerts at 100% don't.
- Do your alerts distinguish failure types? "Service down" is a symptom. DNS failure, certificate error, and connection timeout are causes, and they have different fixes.
A monitoring stack that answers all five is one that lets your team sleep through the night. One that only answers the first is just optimistic.
Sources
- SaaS Monitoring: Metrics, Tools, And Best Practices Explained | UptimeRobot Knowledge Hub
- SaaS Monitoring Best Practices - Dotcom-Monitor
- 5 Best Uptime Monitoring Tools in 2026
- Odown Blog | SaaS Application Monitoring Best Practices: A Complete Guide
- What monitoring setup do you use for your SaaS? (uptime, errors, etc.) : r/SaaS
- Five strategies to remove single points of DNS failure - Ably Realtime
- What is a DNS Issue? | What methods can I use to fix DNS issues? | Lenovo US
- domain name system - Avoiding DNS timeouts when a DNSserver fails - Server Fault